It only takes one day. Coral doesn’t consider the 30-year average before bleaching; a wildfire doesn’t wait for annual reports before sparking; ice turns to water at the speed of light. What made the COVID crisis feel more like a crisis was the rapid availability of data. We had access to dashboards of graphs that were updated daily, it evolved for us at a pace we could witness. While the climate, by definition, changes over decades, the experience of that change manifests in the daily present. Each day contributes to those averages. Each day brings us closer or keeps us under the threshold of +1.5°C of warming.
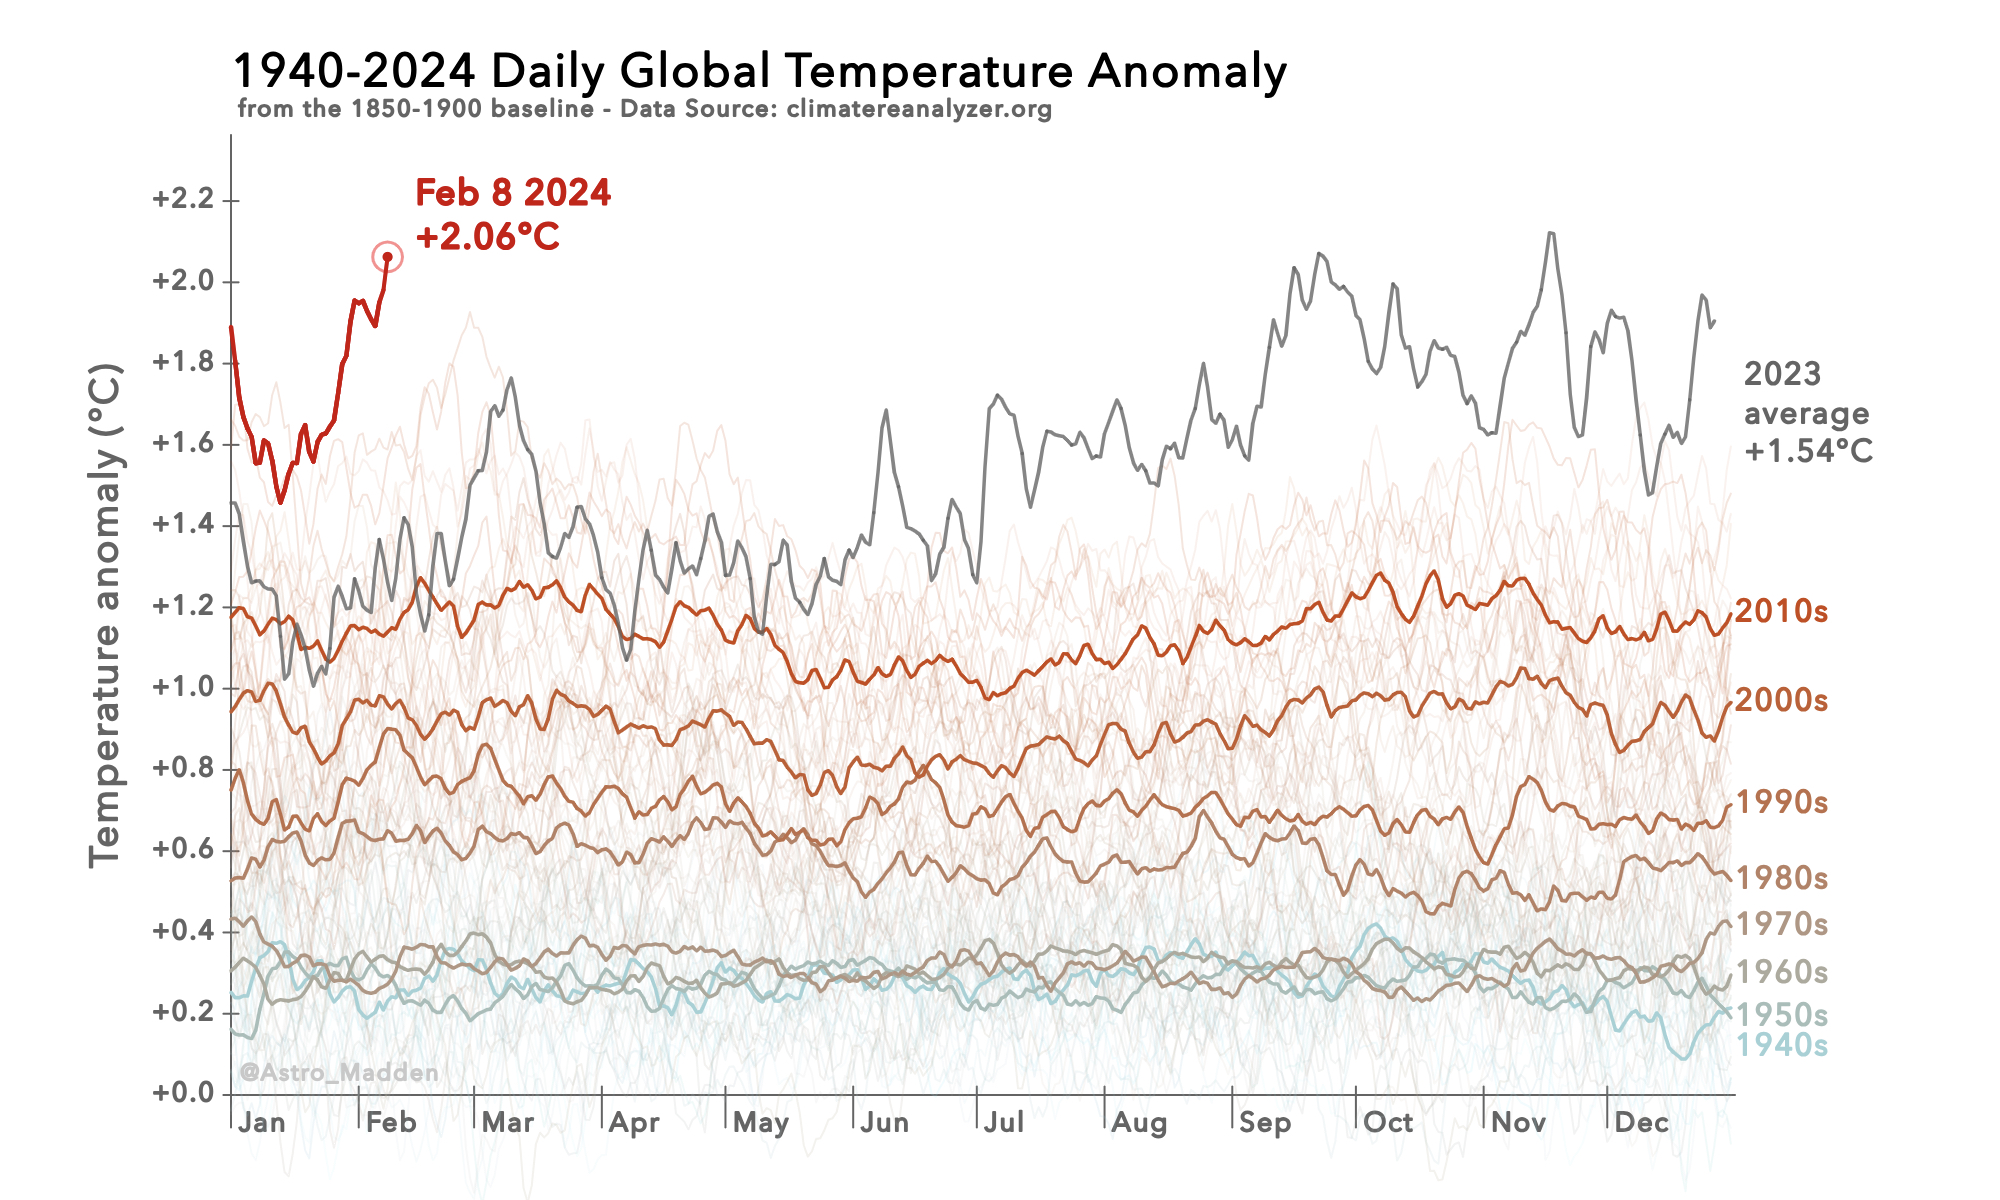
The data I have seen does not express this daily urgency. I realized such a plot could be made using reanalysis data hosted by the University of Maine. Using their absolute surface temperatures, I was able to calculate the offset needed to present the data as an anomaly from the pre-industrial baseline. The result is the most up to date global temperature anomaly chart. The reanalysis data updates daily but on approximately a one week delay.
There are many baselines and ways to calculate the temperature anomaly. The University of Maine even displays a 1979-2000 baseline, but the 1850-1900 range is what the IPCC uses for their target of +1.5°C and +2.0°C of maximum allowed warming. To get the anomaly from the 1850-1900 baseline, I use the ERA5 data from 1950 to the end of 1979 to get an average offset for each day of the year. I then can calibrate the offset using the annual anomalies from the global time series data at berkeleyearth.org. This gave an extra baseline offset of +0.3°C to calibrate a 1950-1979 anomaly to an 1850-1900 anomaly. When added to the ERA5 data, the yearly averages match the BerkeleyEarth values. For example, the 2023 offset BerkeleyEarth calculated is +1.54, which is what my process calculates.
See the disclaimer at climatereanalyzer.org to understand how to use this information.